Graphical representation of causal effects
What If: Chapter 6
Elena Dudukina
2021-01-11
Draw your assumptions before your conclusions
- Causal diagrams
- Directed acyclic graphs (DAGs)
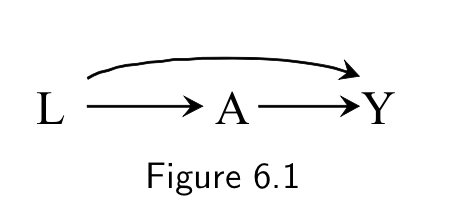
DAGs
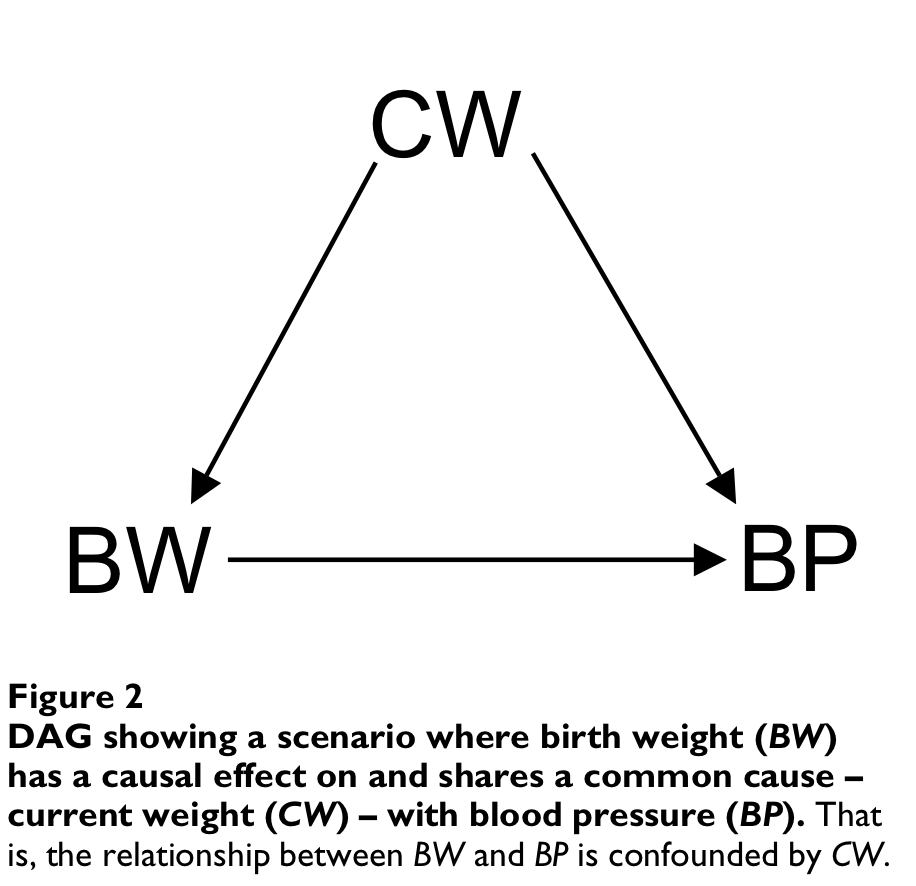
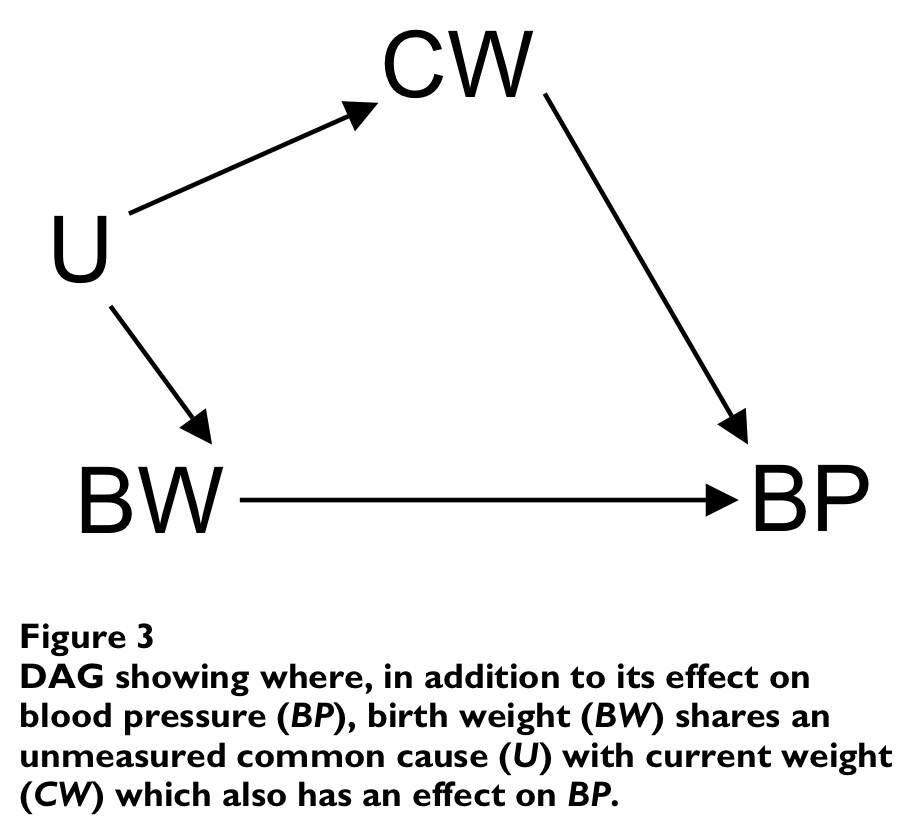
Arah, O. A. 2008. “The Role of Causal Reasoning in Understanding Simpson’s Paradox, Lord’s Paradox, and the Suppression Effect: Covariate Selection in the Analysis of Observational Studies.” Emerg Themes Epidemiol 5 (February): 5. https://doi.org/10.1186/1742-7622-5-5
DAGs
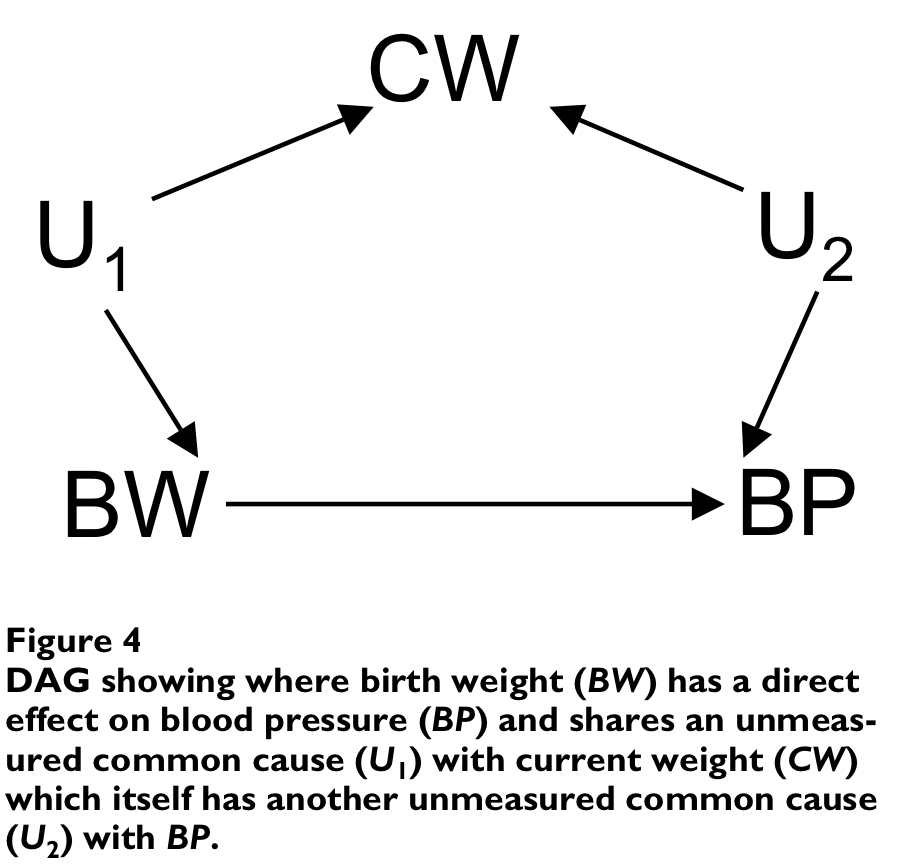
Arah, O. A. 2008. “The Role of Causal Reasoning in Understanding Simpson’s Paradox, Lord’s Paradox, and the Suppression Effect: Covariate Selection in the Analysis of Observational Studies.” Emerg Themes Epidemiol 5 (February): 5. https://doi.org/10.1186/1742-7622-5-5
When we observe a statistical association between two variables
1) Two variables are a cause and the consequence
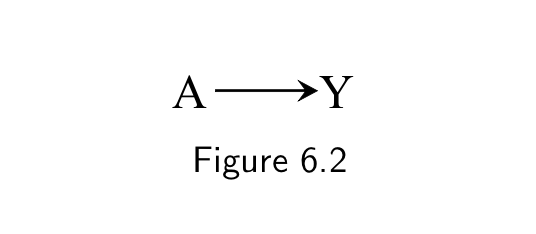
When we observe a statistical association between two variables
1) Two variables are a cause and the consequence

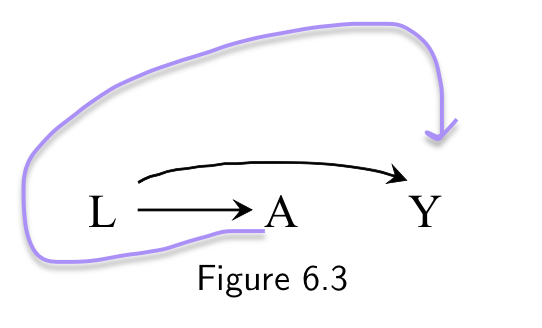
2) Two variables have a common cause (a confounder)
- A and Y are associated even though A does not cause Y
- Example: L - smoking, A - carrying a lighter, Y - lung cancer
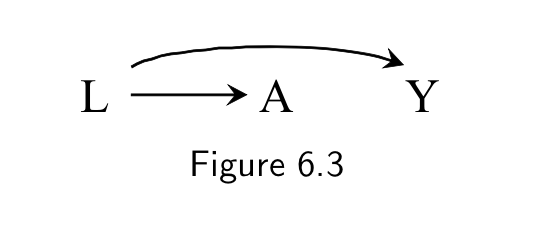
When we observe a statistical association between two variables
3) Two variables share a common consequence or a child of a common consequence, which was conditioned on
- E and D are associated even though E does not cause D (or vice versa)


Hernán, Miguel A., Sonia Hernández-Díaz, and James M. Robins. 2004. “A Structural Approach to Selection Bias.” Epidemiology 15 (5): 615–25
Associatioin vs Causation
- "Association, unlike causation, is a symmetric relationship between two variables; thus, when present, association flows between two variables regardless of the direction of the causal arrows"
Associatioin vs Causation
"Association, unlike causation, is a symmetric relationship between two variables; thus, when present, association flows between two variables regardless of the direction of the causal arrows"
Association is not causation
Marginal vs conditional probabilities
- Conditional
- The probability that an event Y occurs, given we know some other event A has occurred, is the conditional probability of Y given A
- Pr(Y|A)
- Marginal(unconditional)
- Pr(Y)
- Remembering standardization/adjustment formula
- Pr(Ya)=ΣlPr(Y=1|A=a,L=l)∗Pr(L=l)
- Probability of PO Ya marginal over confounder L
Causal Inference in Statistics: A Primer. Judea Pearl, Madelyn Glymour, Nicholas P. Jewell
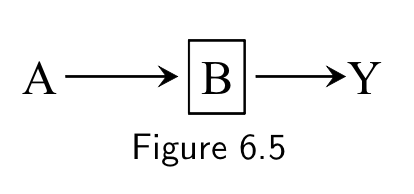
- A⊥⊥Y|B
- A⊥/⊥/Y
Conditioning
- A⊥⊥Y|L
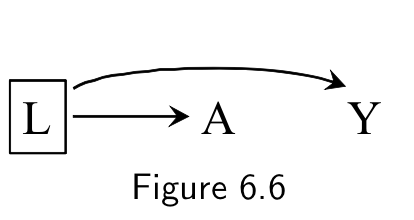
- A⊥/⊥/Y|L
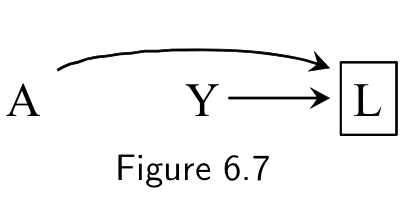
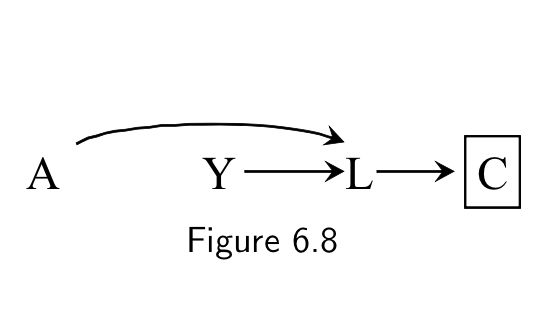
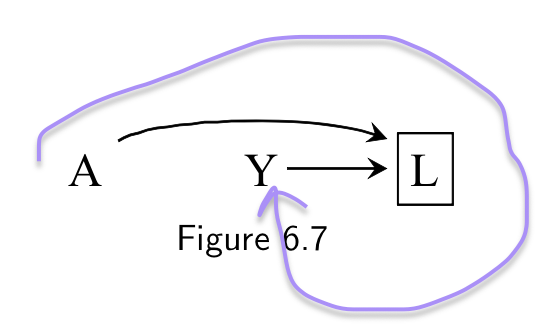
Biasing path
For the association between A and Y
- A --> [L] <--Y
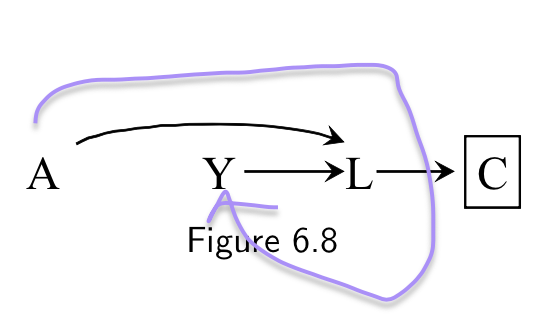
Backdoor path
- A <-- L --> Y
Exchangeability, positivity, consistency
inference is never assumption-free
Systematic bias
- Infinite sample size won't help eliminating systematic bias
- The magnitude of the effect is off
Structural definition of bias
- Common causes --> confounding

- Conditioning on common effects --> selection bias (collider stratification bias)


- Information (measurement) error --> later in the book
Effect modification structure
- Causal vs surrogate efect modifiers
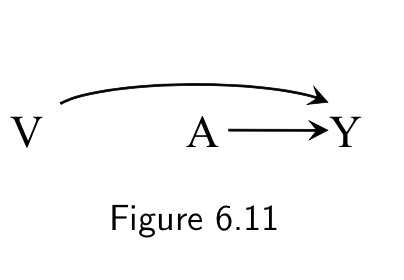
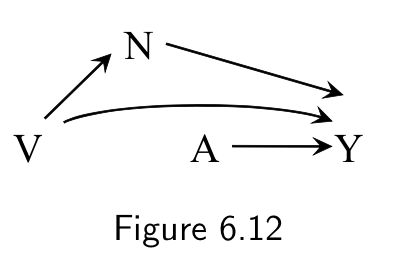
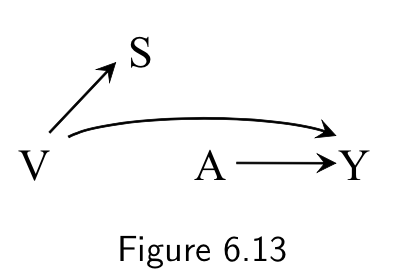
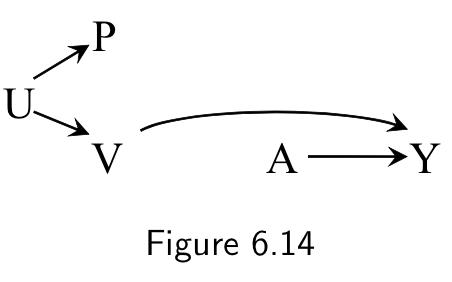
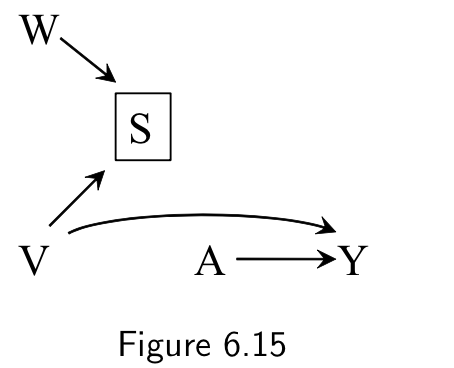
- Structure of the association of the effect modifier with the outcome matters
Interaction in DAGs
- Augmented DAGs
Right. Personally, I’ve found it useful to augment the DAG for heterogeneity as in these from my SER 2015 conference presentation: pic.twitter.com/8QJ26BTx6Y
— Onyi Arah🎄waiting for vaccine🌍 MD, DSc, PhD (@oacarah) September 5, 2019